UNEC Journal of Engineering and Applied Sciences Volume 5, No 1, pages 43-54 (2025) Cite this article, ![]() 1584 https://doi.org/10.61640/ujeas.2025.0505
1584 https://doi.org/10.61640/ujeas.2025.0505
With the recent introduction of nanoalloys into engineering applications, in addition to the limited parameters such as temperature and composition used for phase setting in traditional alloys, a third parameter such as the size of the particles has emerged, which has made the properties that can be obtained from the materials almost limitless. Nanoalloys, which have various applications such as data storage, catalysts, biosensors and cancer therapy, demand more theoretical predictions than ever before due to their complex structure and diversity [1]. New synthesis routes, new nanoalloys and new properties are announced every day, so new theories that can deal with nanoalloys are highly desired.
Nanomaterials serve as a bridge between atomic and macro systems; due to their short-scale structure and high abundance of surface atoms compared to their bulk counterparts, they offer attractive potential for emerging applications [2]. After many studies on pure nanostructured elements, in recent years researchers have turned to nanostructured alloys because of the unique chemical and physical properties of nanoalloys, the diversity and composition of their components, the atomic arrangement, size and shape of nanoparticles can be adjusted and completely new structural motifs can be created [3, 4]. Nanoalloys are generally classified according to their mixing patterns and geometric shapes with or without ordered crystalline structure [3, 5]. Different shapes and atomic arrangements significantly affect the physical and chemical properties of nanoalloys [3, 5-7]. Although the mixing pattern and geometric shape of nanoalloys depend on many parameters, the main factors that enable the formation of these structures are: atomic sizes, surface energies, molecular energies, strength of interatomic bonds, electronic and magnetic effects, etc. [3- 7]. Nowadays, nanoalloy studies generally proceed in two different directions: experimental and modelling. Unlike traditional alloys, phase diagrams are insufficient to predict the physical properties and structural formations of nanoalloys below critical dimensions, because the properties of nanoalloys depend on both particle size, composition and atomic distribution. Therefore, theoretical studies have become more important than ever in order to predict experimental results and shorten the experimental time.
In this study, we focused on ordered FeNi3 nanoalloys consisting of crystalline bulk and nanoparticles (NPs) because Fe-Ni-based nanoalloys have promising applications in chemical industry, aerospace and defence industry, magnetic biomedical applications and computer hardware industry among magnetic materials. However, although modelling and computer simulation techniques have long been widely used to investigate the structural properties of bulk [8-14] and nanostructured [15, 16] Fe-Ni based alloys, it is very important to predict and determine the thermally stable sizes and shapes of NPs since sufficient studies have not been conducted on the application areas of these nanoalloys [1- 7]. In order to meet this demand and contribute to the literature, the local structural evolutions and stabilities of ordered crystalline bulk and NPs of FeNi3 alloy with particle sizes of 2, 4 and 6 nm were modelled and simulated over a wide temperature range (from room temperature to 1700 K) using EAM-MD simulation methods in the Large Scale Atomic/Molecular Massively Parallel Simulator (LAMMPS).
2.1. Calculations of pairwise interatomic interaction potentials Although modelling and simulation methods based on quantum-mechanics provide the most successful results, they are generally preferred for small systems due to the need for high computational capacity. However, it is known that molecular dynamics simulations can provide accurate results for large systems when the correct interaction potential is defined [16, 17]. In this study, the Embedded Atom Model (EAM), which also takes into account the electron density, was used instead of binary interaction methods, which are often inadequate to study the interactions between atoms in transition metals. The EAM method is based on density functional theory and takes into account the many-body interaction through the electron density of the systems, and therefore EAM can give more accurate results than pairwise interaction models with reasonable computational time for Fe-based systems [18-20].
In this study, the EAM parameters determined in [18] were used to calculate the embedding energy change with electron density and the dependence of electron density on the interatomic separation distance in FeNi3 alloy by means of the LAMMPS program system; the details of these calculations can be found in our previous studies on Fe-based amorphous alloy systems [19, 20].
2.2. MD simulations of FeNi3 nanoparticles
MD simulations were performed through the MedeA-LAMMPS molecular dynamics simulator program system, and the details of the calculations for the bulk form of FeNi3 alloy with 27436 atoms can be found in our previous study on the stability and local structural evolutions of bulk and NPs of FeNi3 amorphous alloys [20]. During the simulation of crystalline NPs, it was assumed that they have the same crystal structure as their bulk counterparts. The MedeA-LAMMPS molecular dynamics simulator program system was used to produce three different spherical crystalline NPs having diameters of 2, 4 and 6 nm with 360, 2952 and 10168 total numbers of atoms, respectively, and one crystalline NP with a cubic structure (length of one side is 2.8 nm) having 2048 numbers of atoms. The temperature dependence of the structural evolution was investigated under vacuum condition by increasing the temperature with intervals of 200 K up to 1700 K. Before the simulation of each NP, the systems were relaxed by the conjugate-gradient energy minimization method.
3.1. Radial distribution functions (RDF) for the bulk FeNi3 alloy
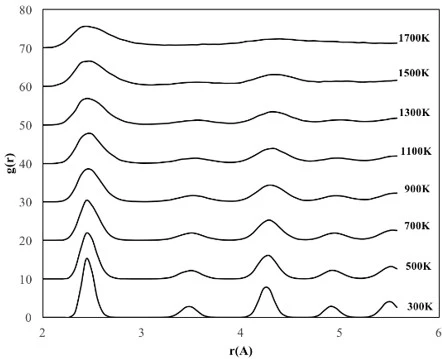
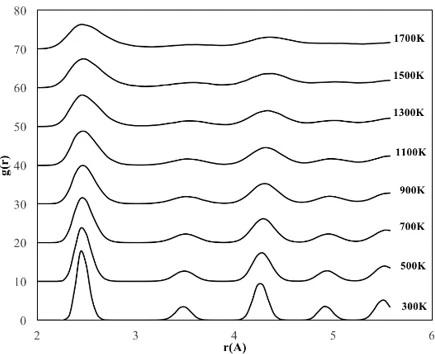
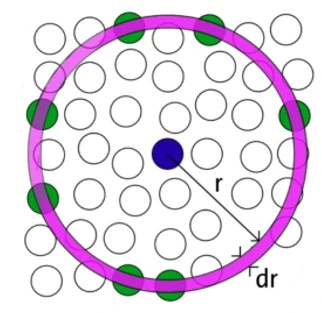
RDFs are used to verify the structural evolution of bulk and nanostructured alloys during heating and cooling. Given a homogeneous distribution of atoms in space, the RDF represents the probability of finding an atom in a shell (dr) at the specified distance (r) from another atom chosen as a reference point, figure 1.
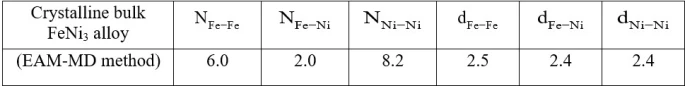
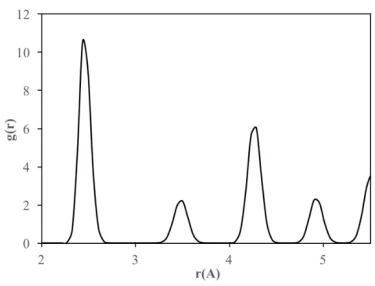
Therefore, the structure formation and evolution and stability of crystalline FeNi3 cubic and spherical NPs with a diameter of 2-6 nm were investigated by calculating RDFs over a wide temperature range (300–1700 K). Additionally, the lattice constant of each NP was calculated using the second peak in the RDFs at 300 K. The RDF for the bulk crystalline FeNi3 alloy after slow cooling given in figure 2 shows that the alloy has a long-range ordered structure and there is no possibility of finding an atom between the peaks. The position of the first peak in the RDF plot corresponds to the closest interatomic distance estimated as 2.44 Å at room temperature (300 K). The position of the second peak corresponding to the alloy lattice parameter is found as 3.50 Å, proving that the final bulk crystalline structure of FeNi3 alloy is the Ll2-type ordered FCC structure.
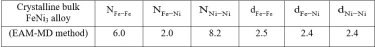
Partial coordination numbers (CN) and first nearest-neighbor distances of bulk crystalline FeNi3 alloy are given in table 1. The total CN of the crystalline structure calculated from RDF was estimated to be 12, indicating that it has FCC crystal structure.
3.2. RDFs for crystalline FeNi3 Nanoparticles
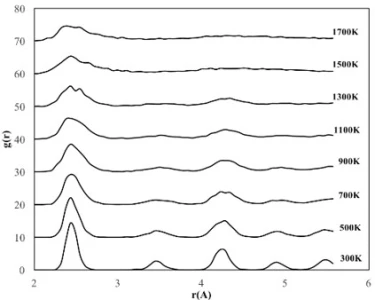
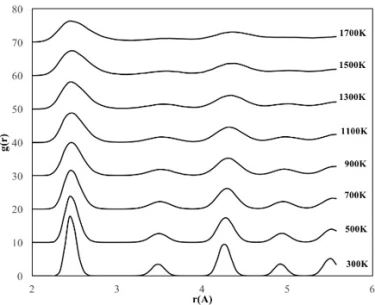
The temperature dependencies of RDF for 2, 4 and 6 nm spherical crystalline NPs are given in figure 3a, b and c, respectively. The NP having the diameter of 2 nm consists of 360 atoms in total, with 90 Fe and 270 Ni atoms. To study the temperature effect on the structural evolution of the NPs, the temperature was increased from 300 K to 1700 K at 200 K intervals. As seen in figure 3a, the 2 nm diameter FeNi3 spherical crystalline nanoparticle maintained its ordered structure with a lattice parameter of 3.44 Å up to 700 K. It is observed that after this point, the NP starts to lose its initial structure and broadening and splitting, which is a sign of amorphous structure formation, are observed at the second peak. At temperatures above 900 K, melting started from the outer surface, but the ordered structure was maintained in the interior of the NP up to 1300 K. As a result, the peak positions remained constant, only the peak shapes widened, the height of the peaks and the depth of the valley between the peaks decreased. When the temperature reached 1500 K, the particles were completely melted and the ordered atomic arrangement was lost even in the interior.
The 4 nm NP consists of a total of 2952 atoms, including 738 Fe atoms and 2214 Ni atoms. To investigate the temperature effect on the structural evolution of the 4 nm diameter NP, the same procedure applied to the 2 nm NP was repeated and the calculated results are shown in figure 3b. The RDFs of 4 nm crystalline NP showed essentially similar trend with 2 nm diameter NP, but the ordered structure was maintained at higher temperatures and no amorphous phase was observed during the heating process of this NP. Although the ordered structure starts to deform at 1100 K and accordingly the peak height decreases and the peak width increases, the peak positions of the RDFs remain almost constant up to 1500 K, indicating that the ordered crystal structure is partially preserved up to this temperature and the 4 nm NPs melt at 1700 K. Moreover, geometric deformation in 4 nm crystalline NPs was also observed due to lattice parameter change, i.e., up to 1100 K the lattice parameter remained constant as 3.5 Å, while above 1100 K it increased up to 3.56 Å. The 4 nm NP consists of a total of 2952 atoms, including 738 Fe atoms and 2214 Ni atoms. To investigate the temperature effect on the structural evolution of the 4 nm diameter NP, the same procedure applied to the 2 nm NP was repeated and the calculated results are shown in figure 3b. The RDFs of 4 nm crystalline NP showed essentially similar trend with 2 nm diameter NP, but the ordered structure was maintained at higher temperatures and no amorphous phase was observed during the heating process of this NP. Although the ordered structure starts to deform at 1100 K and accordingly the peak height decreases and the peak width increases, the peak positions of the RDFs remain almost constant up to 1500 K, indicating that the ordered crystal structure is partially preserved up to this temperature and the 4 nm NPs melt at 1700 K. Moreover, geometric deformation in 4 nm crystalline NPs was also observed due to lattice parameter change, i.e., up to 1100 K the lattice parameter remained constant as 3.5 Å, while above 1100 K it increased up to 3.56 Å.
The crystalline NP with a diameter of 6 nm contains 2542 Fe atoms and 7626 Ni atoms (10168 atoms in total). According to the RDF of the crystalline NP with a diameter of 6 nm (figure 3c), the depth of the valley between the peaks and the height of the peaks decreased due to the melting on the surface, while some ordered atomic arrangement with a lattice parameter of 3.5 Å was maintained in the interior of the particle up to 1300 K, which is higher than the deformation temperatures of 4 nm and 2 nm NPs. This means that the 6 nm diameter NP shows the most stable structure at higher temperatures and after 1300 K, the initial ordered crystal structure of this NP starts to disappear with increasing lattice parameter.

Figure 3. RDF plots of spherical crystalline FeNi3 NPs of (a) 2 nm, (b) 4 nm and (c) 6 nm at different temperatures
From the RDFs of the studied spherical nanoparticles (figure 3), it was found that the NPs gradually deformed due to the temperature increasing process. However, as the size of the particle increased, the crystalline NPs retained their initial structure at higher temperatures due to the decrease in the ratio of surface atoms. For example, crystalline NPs with a diameter of 2 nm began to lose their initial ordered structure at 700 K, while NPs with a diameter of 4 nm and 6 nm began to undergo deformation after 1100 K and 1300 K, respectively.
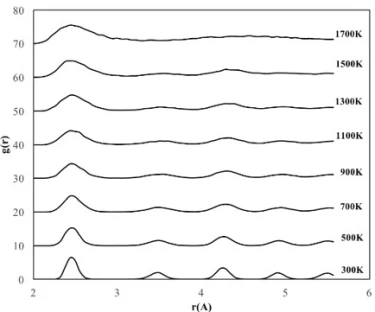
The crystalline NP with a cubic structure of 2.8 nm length consists of a total of 2048 atoms, 512 Fe atoms and 1536 Ni atoms, whose RDF graphs are shown in figure 4.
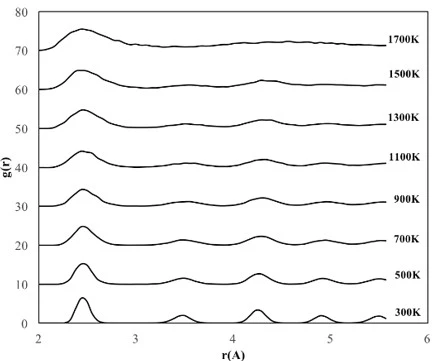
Figure 4. RDF graphs of the cubic shaped crystalline FeNi3 NP at different temperatures
According to figures 3b and 4, the RDF variation with temperature for cubic shaped FeNi3 NPs showed a similar trend as 4 nm spherical NPs and started deformation at 1100 K even though the cubic shaped crystalline NP had fewer atoms than the 4 nm spherical NP. These results can be attributed to the comparable initial surface area of cubic (43.6 m2) and 4 nm spherical (42.5 m2) FeNi3 NPs.
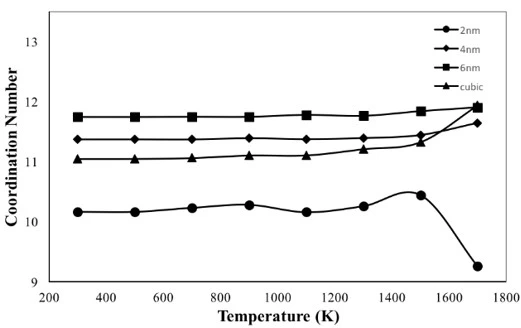
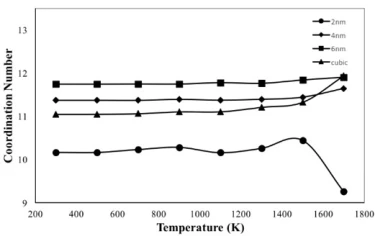
Figure 5. Coordination number variation of the crystalline FeNi3 NP with respect to temperature
The temperature dependences of coordination number (CN) for crystalline NPs are given in figure 5. According to figure 5, the CN of 6 nm particle has the highest value of 11.7 among the studied NPs at 300 K and remained almost constant during heat treatment, fluctuating between 11.7 and 12, which is the closest value to the CN of bulk FeNi3 alloy (12) with L12-type ordered structure at room temperature. The CN of the 4 nm particle did not change significantly during the heating process, but its calculated magnitude (about 11.4) was less than the CN of the 6 nm particle. The cubic shaped NP had a CN of 11 in the temperature range from room temperature to 1000 K, then its magnitude increased and reached a maximum value equal to the CN of the 6 nm spherical particle at 1700 K.
On the other hand, 2 nm particle has the smallest CN value (10.2) among NPs at room temperature, its CN fluctuates around 10.4 during heat treatment up to 1500 K and then decreases reaching the minimum value of 9.2 at 1700 K. This can be explained by the fact that 2 nm NP has the highest surface-to-volume ratio and probably the surface atoms have a looser structure at high temperatures near and above the melting temperature.
3.3. Structural evolutions in crystalline FeNi3 NPs
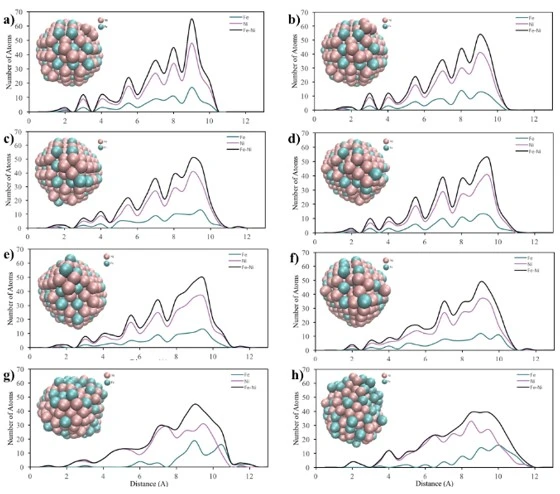
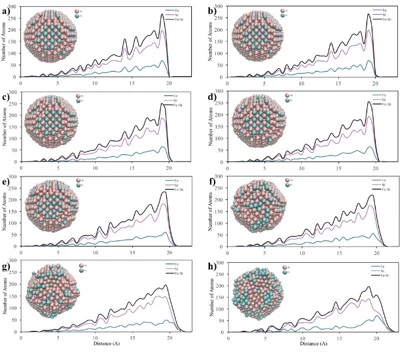
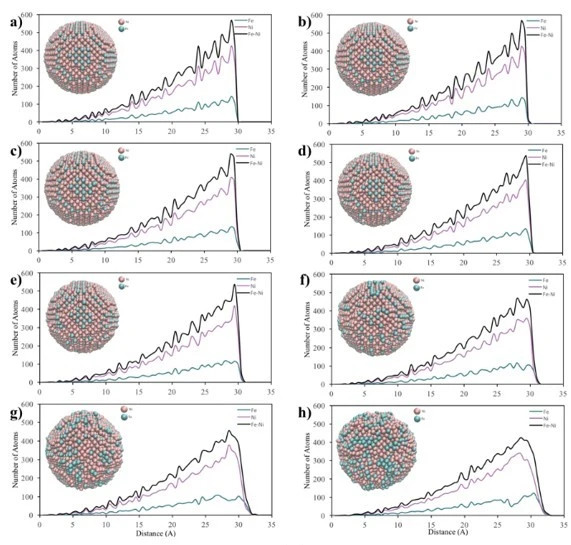
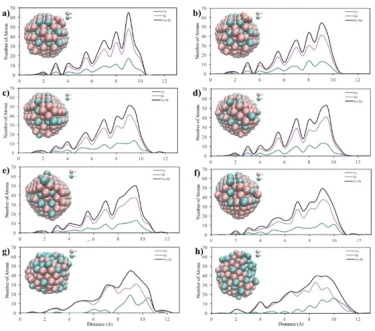
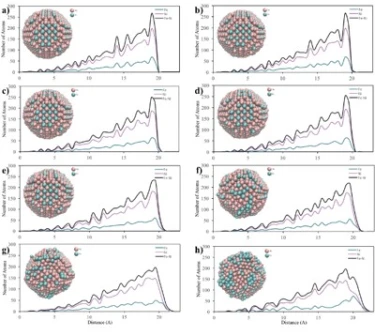
Figure 6. Core-to-surface concentration profiles of Fe and Ni atoms in a) 2 nm, b) 4 nm and c) 6 nm crystalline NPs at (a) 300 K, (b) 500 K, (c) 700 K, (d) 900 K, (e) 1100 K, (f) 1300 K, (g) 1500 K and (h) 1700 K temperatures
a)
Core-to-surface concentration plots provide a profile of the spatial arrangement of atoms. The calculated core-to-surface concentration profiles of Fe and Ni atoms in spherical 2, 4 and 6 nm NPs are shown in figure 6.
From the graphs in figure 6a, it can be seen that initially the 2 nm bimetallic NP had an ordered mixed pattern and as the temperature increased, the surface firstly started to melt at 500 K. Then, after 700 K, the ordered structure started to deform and the Fe atoms moved towards the outer shell of the particle and at 1500 K, the particle had a mixed shell consisting of Fe and Ni atoms surrounding the Ni core. In addition, from the morphological point of view, the spherical shape of the 2 nm NP changed after the temperature of 700 K. Then, when 1500 K was reached, the ordered structure with spherical shape completely disappeared, forming a new shape, which was consistent with the RDF graphs (figure 3a).
According to the core-surface concentration profile of 4 nm diameter NP, figure 6b, it is clear that the regularly mixed NP maintained its lattice structure up to 1500 K. After this point, a random mixing pattern was obtained throughout the particle, where the outer shell was mostly composed of Fe atoms. Furthermore, as can be seen from the visualization of the 4 nm diameter spherical NPs, the initial structure started to disappear after 1100 K, and at 1700 K, the spherical structure was deformed due to melting.
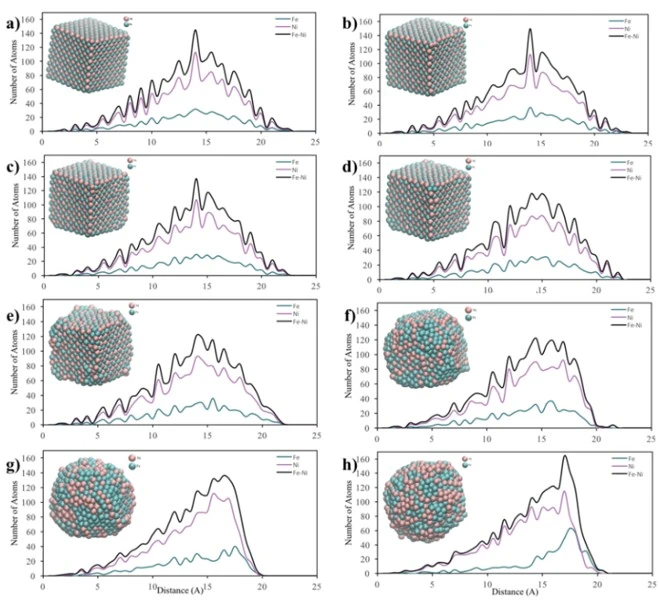
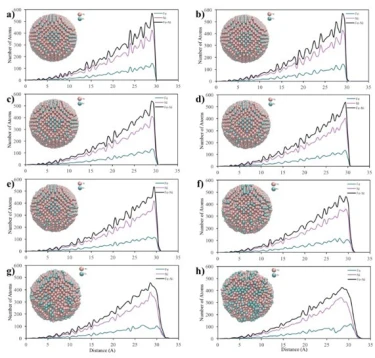
Figure 7. Core-to-surface concentration profiles of Fe and Ni atoms in the cubic shaped crystalline NPs at a) 300 K, b) 500 K, c) 700 K, d) 900 K, e) 1100 K, f) 1300 K, g) 1500 K and h) 1700 K temperatures
In the core-to-surface concentration profile of the 6 nm NP shown in figure 6c, it is seen that there is no melting on the surface up to 1100 K and the initial ordered structure is preserved up to 1500 K. After this temperature, although the atomic concentration on the surface changed, the ordered atomic arrangement throughout the particle remained almost the same and no core-shell structure was observed. Moreover, from a morphological point of view, it is clearly seen that the 6 nm spherical NP largely maintains its spherical shape even at high temperatures.
For the cubic shaped NP, the core-to-surface concentration profiles shown in figure 7 reveal that the initial structure with regular mixing pattern remains unchanged up to 900 K. However, upon reaching the heating temperature of 1500 K, the particle is seen to be completely deformed and loses its cubic profile, and a structure similar to a spherical particle profile is formed with Fe atoms on its surface.
According to the core-surface concentration profiles of NPs with different shapes and sizes given in figures 6 and 7, it is obvious that the morphology of NPs is highly dependent on temperature, size and shape. The deformation mechanism of crystalline NPs extracted from the core-surface concentration profiles is largely in good agreement with their RDF; for example, all particles deform as the temperature increases, but 6 nm NP mostly maintains its spherical shape even at high temperatures. Moreover, the most deformation of the initial shape was observed in cubic shaped NP, as the temperature increased from 300 K to 1700 K, the initial cubic shaped structure completely disappeared and transformed into spherical shape.
3.4. Voronoi analysis of crystalline FeNi3 NPs
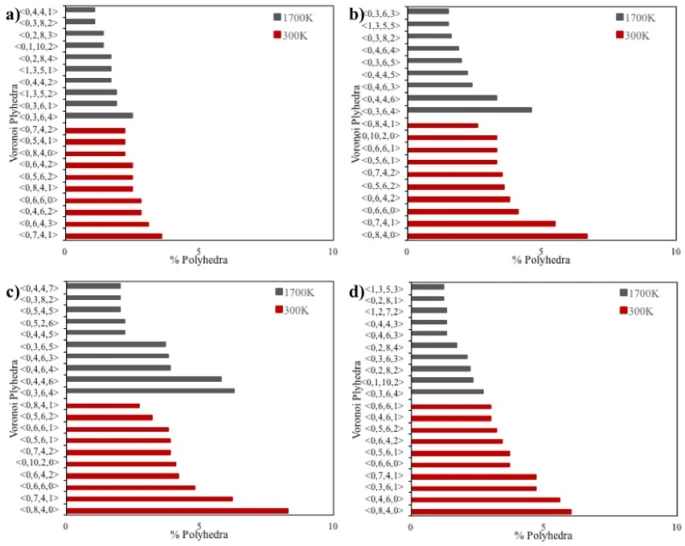
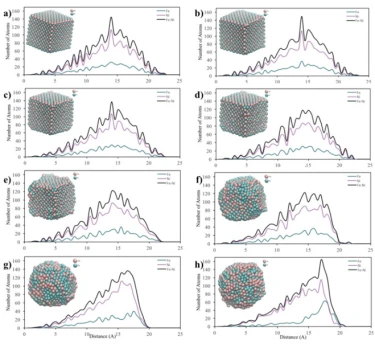
Figure 8. Voronoi analysis of spherical with a) 2, b) 4 and c) 6 nm diameters and d) cubic shaped crystalline FeNi3 NPs
The results of the Voronoi analysis for spherical and cubic shaped NPs are shown in figure 8, listing the ten most common Voronoi polyhedra for each NP. As seen in figure 8, the polyhedra in the liquid phase (1700 K) and the solid phase (300 K) are completely different from each other on the basis of the possible stable crystal structure. It is known that the Wigner-Seitz cell of the FCC lattice (a special case of Voronoi cells dealing with lattice vectors) is the rhombic do-decahedron (<0,12,0,0>) with high rectangularity [21], while at the nanometer scale the most stable polyhedral structures for the FCC lattice are the cubo-octahedron and the truncated-octahedron [22].
According to the Voronoi tessellations of crystalline NPs, particles with diameters of 4 and 6 nm (figures 8b and c) had almost the same topological structure when they were in the solid phase at 300 K. Although some polyhedra in 2 nm spherical (figure 8a) and cubic shaped (figure 8d) NPs are different from 4 and 6 nm diameter NPs, the main polyhedra in the studied NPs were found to be <0,6,4,2>, <0,8,4,0>, <0,7,4,1>, and <0,5,6,2>. These polyhedra consist of pentagonal, hexagonal and rectangular faces corresponding to the truncated-octahedron and the tetra-decahedron, which is a regular form of the truncated-octahedron [23]. Moreover, as the particle size increased to 4 and 6 nm, deformed rhombic do-decahedron structures (<0, 10, 2, 0 >) with more than 80 % rectangular faces began to be observed in small amounts.
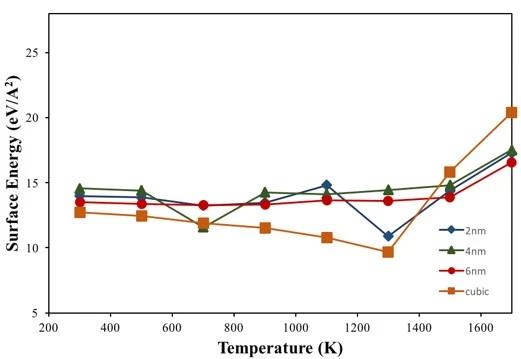
3.5. Surface energy and melting temperature of crystalline FeNi3 NPs
The magnitude of surface energy is an important parameter for the prediction of the physico-chemical behaviour of NPs; for example, the potential applications of NPs as catalysts, drug delivery, etc. are directly related to the degree of surface tension on NPs. Since the stability of NPs is controlled by the surface energy, many properties such as structural stability, oxidation-decomposition and susceptibility to degradation are affected by the change of surface energy. In this context, the effects of particle size and temperature on the change of surface energy should be investigated for a detailed understanding of the structural evolution of NPs.
NPs having a limited number of atoms do not always obey the thermodynamic variables and therefore the surface energy of NPs was calculated using the following equation [19],
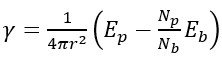 (1)
(1)
here r is the nominal radius of the NP; Ep and Eb are the potential energies of the NP and its bulk counterparts, respectively; Np and Nb are the numbers of atoms in the NP and in the bulk sample, respectively.
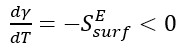
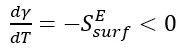
In equation 1, (Eb/Nb) is the potential energy per atom in the bulk system and (NpEb/Nb) is the potential energy of a bulk system containing the same number of atoms as NP. The temperature dependence of the surface energy is related to the excess surface entropy and is an indicator of the surface entropy contribution of the system [19],
 (2)
(2)
The temperature coefficient of the surface energy, ( ), is a measure of disorder and decreases with increasing temperature (
 ), meaning that surface atoms would have a higher entropy than bulk/core atoms.
The temperature-dependent surface energy of crystalline NPs shown in figure 9 reveals that cubic and spherical NPs have surface energy values close to each other at room temperature. In terms of spherical NPs, 6 nm NP has the lowest surface energy value compared to 2 and 4 nm NPs due to having a low surface-to-volume ratio of 0.924 (2 and 4 nm NPs have 2.776 and 1.269, respectively). Although the cubic NP had a higher surface to volume ratio (1.929) than the 6 nm NP, the surface energy value of the cubic NP remained at the lowest value due to its low surface area.
In general, according to equation 2, the surface energy should decrease at higher temperatures due to the increasing entropy of the system. During the temperature increasing process, figure 9, the surface energies of NPs tend to decrease up to 1300 K as expected, but above this temperature the surface energies start to increase while minimizing their surface entropy. This anomalous behavior is thought to be due to the fact that the surface atomic arrangement of the NPs is different from the interior and a denser structure is formed in the liquid phase compared to the solid phase.
Like surface energies, melting temperature is directly related to the surface-to-volume ratio of NPs, and an increase in this ratio should lead to a decrease in the melting temperature of the particles due to the higher percentage of less coordinated and less bonded surface atoms [24]. This is proven by MD simulations for spherical NPs of different diameters; i.e., the melting temperature of 2, 4 and 6 nm NPs was found to be 1381 K, 1600 K and 1715 K, respectively, which coincides well with the respective surface-to-volume ratios of these particles. On the other hand, the crystalline nanoparticle with cubic structure behaved differently, although the cubic nanoparticle had a large surface-to-volume ratio, it started to melt at 1645 K, which is very close to the melting point of the 4 nm NP, probably due to its similar surface area. These results show that there is also a strong size and shape dependence in the melting behavior of NPs.
The formation, evolution and stability of crystalline bulk and nanoparticles (NPs) of FeNi3 intermetallic were analyzed using the EAM-MD method in a wide temperature range (300-1700 K). The results of theoretical predictions can be summarized as follows: Structural analysis showed that all crystalline NPs deformed at high temperatures, but the deformation became negligible when the particle size increased to 6 nm, and the 6 nm particles exhibited the most thermostable behavior while maintaining a stable structure due to the decrease in surface-to-volume ratio. According to the spatial ordering of NPs, in general, an ordered mixed pattern was obtained without segregation or formation of core-shell structure, although some Ni atoms preferred to be located on the core side of 2 nm NPs. The coordination number (CN) of crystalline NPs was shown to vary with temperature. The CN of the 6 nm particle was calculated as 11.7 at 300 K and remained almost constant between 11.7 and 12 during heat treatment, which is the closest value to the CN of bulk FeNi3 with L12-type ordered structure at room temperature. Moreover, while the CN of cubic NP is initially 11, above the temperature of 1500 K the CN increases significantly. Three-dimensional (3D) atomic configuration of crystalline FeNi3 NPs via Voronoi analysis reveals that crystalline NPs with diameters of 4 nm and 6 nm have almost the same topological structure in the solid phase at 300 K. Although some polyhedrons in 2 nm and cubic NPs differ from 4 nm and 6 nm diameter NPs, the main polyhedrons in the solid phase of cubic and spherical NPs with crystalline structure are <0,6,4,2>, <0,8,4,0>, <0,7,4,1> and <0,5,6,2>. These polyhedrons consist of pentagonal, hexagonal and rectangular faces corresponding to the truncated-octahedron and the tetra-decahedron, which is a regular form of the truncated-octahedron. Surface energies of NPs tend to decrease up to 1300 K, but above this temperature the surface energies start to increase while minimizing their surface entropy. This anomalous behavior (positive temperature coefficient) is thought to be due to the fact that the surface atomic arrangement of the NPs is different from the interior and a denser structure is formed in the liquid phase compared to the solid phase. The melting temperature of NPs shows a strong size and shape dependence. Increasing particle size results in higher melting temperatures of the NPs approaching the melting point of the bulk phase, due to the decreased surface-to-volume ratio of the NPs.
1 Nanoalloys: From Fundamentals to Emergent Applications, ed: F. Calvo, 2-nd Edition, Elsevier Ltd (2020). https://doi.org/10.1016/C2018-0-05185-3
2 M.F. Ashby, P.J. Ferreira, D.L. Schodek, Nanomaterials, Nanotechnologies and Design, e-book, Elsevier Ltd (2009). https://doi.org/10.1016/B978-0-7506-8149-0.X0001-3
3 R. Ferrando, J. Jellinek, R.L. Johnston, Chem. Rev. 108(3) (2008) 845. https://doi.org/10.1021/cr040090g
4 Sh. Moussa, V. Abdelsayed, M.S. El Shall, From Fundamentals to Emergent Applications (2013) 1. http://dx.doi.org/10.1016/B978-0-12-394401-6.00001-1
5 F. Baletto, R. Ferrando, Rev. Mod. Phys. 77(1) (2005) 371. https://doi.org/10.1103/RevModPhys.77.371
6 K. McNamara, S.A.M. Tofail, N.D. Thorat, J. Bauer, J.J.E. Mulvihill, In Nanoalloys: From Fundamentals to Emergent Applications (2020) 381. https://doi.org/10.1016/B978-0-12-819847-6.00016-4
7 R. Ferrando, Structure and Properties of Nanoalloys, e-book 1-st edition 10 Elsevier Inc. (2016).
8 A. O. Mekhrabov, M. Doyama, Phys. Stat. Sol. (B) 126(2) (1984) 453. https://doi.org/10.1002/pssb.2221260203
9 Z.A. Matysina. A. O. Mekhrabov, Z.M. Babaev et al., Phys. Stat. Sol. (b) 138(2) (1986) 399. https://doi.org/10.1002/pssb.2221380203
10 Z.A. Matysina, A.O. Mekhrabov et al., J. Phys. Chem. Sol. 48 (1987) 419.
11 A.O. Mekhrabov, Hyperfine Interactions 59 (1990) 337. https://doi.org/10.1007/BF02401242
12 Y. Mishin, M.J. Mehl, D.A. Papaconstantopoulos, Acta Mater. 53(15) (2005) 4029. https://doi.org/10.1016/j.actamat.2005.05.001
13 G. Cacciamani, A. Dinsdale, M. Palumbo, A. Pasturel, Intermetallics 18(6) (2010) 1148. https://doi.org/10.1016/j.intermet.2010.02.026
14 H.P. Cheng, D.E. Ellis., Phys. Rev. B 39(17) (1989) 12469. https://doi.org/10.1103/physrevb.39.12469
15 K. Kadau, M. Gruner, P. Entel, M. Kreth, Phase Transitions 76(4-5) (2010) 355. https://doi.org/10.1080/0141159021000051433
16 J. Chen, P. Li, E.E. Lin, RSC Adv. 10 (2020) 40084. https://doi.org/10.1039/D0RA07831J
17 H. Ehrenreich, F. Spaepen, Solid-State Physics: Advances in Research and Applications, vol. 54, Academic Press, 1999.
18 G. Bonny, R.C. Pasianot, L. Malerba, Model. Simul. Mater. Sci. Eng. 17(2) (2009) 025010. https://doi.org/10.1088/0965-0393/17/2/025010
19 M.V. Akdeniz, A.O. Mekhrabov, J. of All. Comp. 788 (2019) 787. https://doi.org/10.1016/j.jallcom.2019.02.271
20 A.O. Mekhrabov, E.A. Irmak, M.V. Akdeniz, J. of Machine Science (AzTU International scientific-technical journal) 2 (2023) 5. https://doi.org/10.61413/cead8914
21 A. Sobolev, A. Mirzoev, AIP Conf. Proc. 1673(1) (2015) 020012. http://dx.doi.org/10.1063/1.4928266
22 S. Ali, V.S. Myasnichenko, E.C. Neyts, Phys. Chem. Chem. Phys. 18(2) (2016) 792. https://doi.org/10.1039/C5CP06153A
23 B.M. Smirnov, Physics of Atoms and Ions, Graduate Texts in Contemporary Physics, Springer, New York (2003) 456 p.
24 F. Calvo, Phys. Chem. Chem. Phys. 17(42) (2015) 27922. https://doi.org/10.1039/C5CP00274E
A.O. Mekhrabov, E.A. Irmak, M.V. Akdeniz, R.M. Rzaev, Modelling and simulations of local structural evolution and stability of bulk and nanoparticles of FeNi3 crystalline alloys, UNEC J. Eng. Appl. Sci. 5(1) (2025) 43-54. https://doi.org/10.61640/ujeas.2025.0505
Anyone you share the following link with will be able to read this content:
This article is licensed under the Creative Commons Attribution ( CC BY 4.0 ) License, which permits unrestricted use, distribution, and reproduction in any medium, provided the original author and source are credited.


Nanoalloys: From Fundamentals to Emergent Applications, ed: F. Calvo, 2-nd Edition, Elsevier Ltd (2020). https://doi.org/10.1016/C2018-0-05185-3
M.F. Ashby, P.J. Ferreira, D.L. Schodek, Nanomaterials, Nanotechnologies and Design, e-book, Elsevier Ltd (2009). https://doi.org/10.1016/B978-0-7506-8149-0.X0001-3
R. Ferrando, J. Jellinek, R.L. Johnston, Chem. Rev. 108(3) (2008) 845. https://doi.org/10.1021/cr040090g
Sh. Moussa, V. Abdelsayed, M.S. El Shall, From Fundamentals to Emergent Applications (2013) 1. http://dx.doi.org/10.1016/B978-0-12-394401-6.00001-1
F. Baletto, R. Ferrando, Rev. Mod. Phys. 77(1) (2005) 371. https://doi.org/10.1103/RevModPhys.77.371
K. McNamara, S.A.M. Tofail, N.D. Thorat, J. Bauer, J.J.E. Mulvihill, In Nanoalloys: From Fundamentals to Emergent Applications (2020) 381. https://doi.org/10.1016/B978-0-12-819847-6.00016-4
R. Ferrando, Structure and Properties of Nanoalloys, e-book 1-st edition 10 Elsevier Inc. (2016).
A. O. Mekhrabov, M. Doyama, Phys. Stat. Sol. (B) 126(2) (1984) 453. https://doi.org/10.1002/pssb.2221260203
Z.A. Matysina. A. O. Mekhrabov, Z.M. Babaev et al., Phys. Stat. Sol. (b) 138(2) (1986) 399. https://doi.org/10.1002/pssb.2221380203
Z.A. Matysina, A.O. Mekhrabov et al., J. Phys. Chem. Sol. 48 (1987) 419.
A.O. Mekhrabov, Hyperfine Interactions 59 (1990) 337. https://doi.org/10.1007/BF02401242
Y. Mishin, M.J. Mehl, D.A. Papaconstantopoulos, Acta Mater. 53(15) (2005) 4029. https://doi.org/10.1016/j.actamat.2005.05.001
G. Cacciamani, A. Dinsdale, M. Palumbo, A. Pasturel, Intermetallics 18(6) (2010) 1148. https://doi.org/10.1016/j.intermet.2010.02.026
H.P. Cheng, D.E. Ellis., Phys. Rev. B 39(17) (1989) 12469. https://doi.org/10.1103/physrevb.39.12469
K. Kadau, M. Gruner, P. Entel, M. Kreth, Phase Transitions 76(4-5) (2010) 355. https://doi.org/10.1080/0141159021000051433
J. Chen, P. Li, E.E. Lin, RSC Adv. 10 (2020) 40084. https://doi.org/10.1039/D0RA07831J
H. Ehrenreich, F. Spaepen, Solid-State Physics: Advances in Research and Applications, vol. 54, Academic Press, 1999.
G. Bonny, R.C. Pasianot, L. Malerba, Model. Simul. Mater. Sci. Eng. 17(2) (2009) 025010. https://doi.org/10.1088/0965-0393/17/2/025010
M.V. Akdeniz, A.O. Mekhrabov, J. of All. Comp. 788 (2019) 787. https://doi.org/10.1016/j.jallcom.2019.02.271
A.O. Mekhrabov, E.A. Irmak, M.V. Akdeniz, J. of Machine Science (AzTU International scientific-technical journal) 2 (2023) 5. https://doi.org/10.61413/cead8914
A. Sobolev, A. Mirzoev, AIP Conf. Proc. 1673(1) (2015) 020012. http://dx.doi.org/10.1063/1.4928266
S. Ali, V.S. Myasnichenko, E.C. Neyts, Phys. Chem. Chem. Phys. 18(2) (2016) 792. https://doi.org/10.1039/C5CP06153A
B.M. Smirnov, Physics of Atoms and Ions, Graduate Texts in Contemporary Physics, Springer, New York (2003) 456 p.
F. Calvo, Phys. Chem. Chem. Phys. 17(42) (2015) 27922. https://doi.org/10.1039/C5CP00274E