From: Modelling and simulations of local structural evolution and stability of bulk and nanoparticles of FeNi3 crystalline alloys
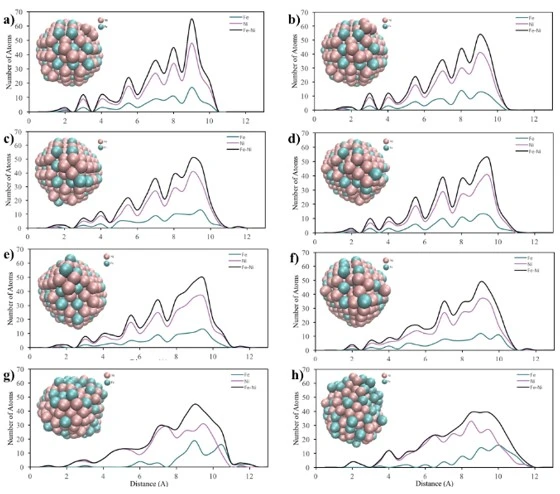
Figure 6. Core-to-surface concentration profiles of Fe and Ni atoms in a) 2 nm, b) 4 nm and c) 6 nm crystalline NPs at (a) 300 K, (b) 500 K, (c) 700 K, (d) 900 K, (e) 1100 K, (f) 1300 K, (g) 1500 K and (h) 1700 K temperatures a)