UNEC Journal of Engineering and Applied Sciences Volume 2, No 2, pages 5-17 (2022) Cite this article, ![]() 1974
1974
As an expanding the production of technical tools over the world, the demand for energy also showing the dramatic increase. Accordingly, the mechanical or thermal problems such as cavitation of materials or enhancement of heat transfer conventional fluids also tend to be influenced on the using of energy consumable tools.
Taking into account such problems, proposed new type of heat-transfer fluids, which obtained by dispersing nano-sized particles of materials with high thermal conductivity in base fluids as water, ethylene glycol etc [1-2].
In the field of solar energy, the efficiency of using nanofluid with Al2O3 particles (volume content up to 1.5%) in solar collectors is substantiated by calculation. It is shown that the transition from water to nanofluids will increase the efficiency of such devices by 30%. This fact is confirmed by the results of the study, where a nanofluid based on water with silver particles was used for the solar collector, the maximum volume content is 0.04%: the maximum efficiency of solar collectors when using a nanofluid reaches 70% [3-4].
In addition, the optical properties of nanofluids are also considered important in the study of thermophysical properties or their efficient use. In these works [5-9], theoretical and experimental results were carried out, and from the discussion it turns out that at different thicknesses and at different concentrations, the absorption coefficient can increase or decrease depending on the wavelength.
Prediction of the effective dynamic viscosity of NF by using empirical models
Case for NF based on MWCNT and CuO
As it’s known, that the characteristics of nanofluids, such as thermal conductivity, viscosity, density and heat capacity, can impact on their overall thermal performances. The viscosity of nanofluids is crucial on the application in thermal systems. Furthermore, viscosity influences to heat transfer enhancement of nanofluids from forced convection and natural convection and appear in many dimensionless numbers and coefficients such as Prandtl number, Brinkman number, Reynolds number, Rayleigh number, and Colburn j-factor used in thermal and fluids sciences [10]. On the aim of investigation of effective viscosity of nanofluids presented several analytical models by researchers [11-13], which can give possibilities of predicting the viscosity of nanofluids respect to volume fraction of nanoparticles. Moreover, there are variety of models, which can illustrate the influence of interfacial layer [14], Brownian motion of particles [15] in base fluid, size or shape factors on effective viscosity. In addition, in [16] work expressed the new analytical model for predicting effective viscosity of nanofluids including influences of nanolayers and Brownian motion of nanoparticles in base fluid. However, it is still actual difficult that the carrying out experimental research for obtaining the kinematic and dynamic viscosity of heat carriers namely, nanofluids based on various nanoparticles. On this aim in [17-20], works have been carried out on experimental research on obtaining effective dynamic viscosity of nanofluids based on CNT and another type of materials. In terms of a hybrid type of nanofluids in [21] given some comparisons of effective dynamic viscosity of hybrid nanofluids at various concentrations, which carried out theoretically and experimentally.
According to the above-mentioned models the effective viscosity of nanofluids can be predicted for proposed materials at varied volume concentrations of nanoparticles.
Objective of this work is an obtaining the curves for predicted effective viscosity of nanofluids based on MWCNT (Carbon nanotubes) by using mentioned theoretical models. Moreover, to show how interfacial nanolayer will impact to viscosity of nanofluids compare to the models, which neglected the effect of layer between particles and base fluid. In addition, to illustrate the comparison of viscosity of nanofluid based on MWCNT with another type of nanofluid, such as CuO based.
Preparation of MWCNT based nanofluids
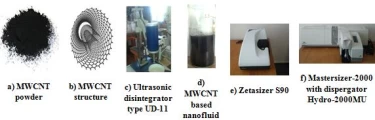
There are several methods for preparing the nanofluids by the mixture of nanoparticles in base fluids, such as the widely used “single-step method” and “two-step method”. According to the preference of many researchers, the “two-step method” is considered as a widely used and convenient one. Regarding this, was chosen the “two-step method” for preparing nanofluids by mixing nanoparticles in deionized water by ultrasonication, which can be illustrated in Figure1(a-f). During the preparation of nanofluids, the working temperature fluctuated from 25 ̊C up to 35 ̊C, where sonication time continued for 30 minutes.
Figure 1. a)-MWCNT nanoparticles; b)-structure of MWCNT nanoparticles; c)-Ultrasonicator; d)-prepared nanofluid based on MWCNT; e) Zetasizer S90; f) Mastersizer-2000 with dispergator Hydro-2000MU

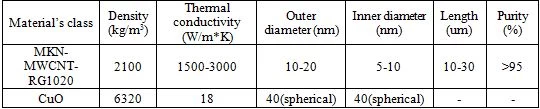
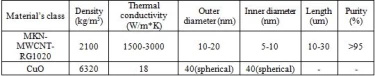
In Figure 1 illustrated the preparation steps of nanofluids based on MWCNT nanoparticles. Apart from this in Figure 1.a) given the MWCNT nanopowder, and in b) illustrated the structure of MWCNT nanoparticles, whereas, in c) and d) presented the ultrasonic disintegrator for sonication of MWCNT nanoparticles in DI water and prepared nanofluids. For obtaining the thermal properties of nanofluids, which were prepared based on MWCNT (MKN-MWCNT-RG1020) nanoparticles with a diameter of 10-20 nm and a length of 10-30 µm, which were measured using the e) Zetasizer S90 and for analyzing of volume distribution used f) Mastersizer-2000 with dispergator Hydro-2000MU (Malvern) available in the laboratory of solar thermal applications of the Physical-Technical Institute of the Academy of Sciences of the Republic of Uzbekistan.
Realization
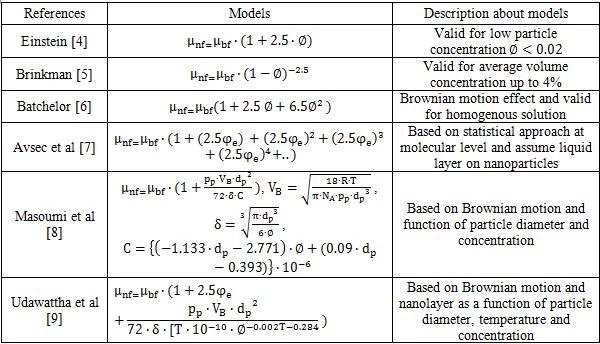
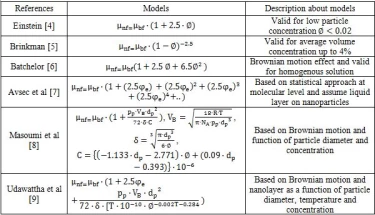
There are presented several analytical models for predicting viscosity of nanofluids by different authors which are described Table 1. By analyzing the models done comparison between proposed models for predicting the effective viscosity respect to concentration and temperature.
Table 1. Analytical models for predicting viscosity of nanofluids by different authors
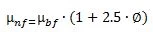
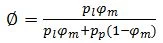
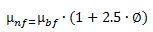 (1)
(1)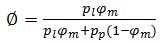 - volume fraction,
  -mass fraction of nanoparticles,
  and
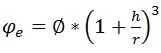
and  -densities of nanoparticles and base liquid, respectively. However, it is important that the interfacial layer between particle and fluid also has a great impact on finding the effective viscosity of nanofluids. The relation can be expressed by the following equation for getting effective viscosity of nanofluids considering interfacial nanolayer.
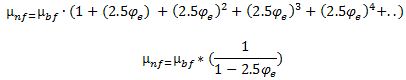 (2)
(2) 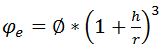 , h and r show the thickness of nanolayer and radius of nanoparticles. Ratio of h/r can be varied in the interval of [0.03;0.2] as given in work [22].
As a result of the conducted numerical study, below expressed the predicted effective viscosity with respect to volume fraction and temperature, respectively Figure 2-4. All calculations were carried out for base fluid and nanoparticles at temperature 20 ℃.
It is clear from Figure 2 that the effective viscosity of nanofluids based on MWCNT nanoparticles increases with the expanding of volume fraction of nanoparticles in the base fluid. Here, given a comparison of four models for predicting the effective viscosity of nanofluid. Accordingly, three Einstein, Brikman, and Batchelor models approximately showed the same result. However, Batchelor’s model illustrated the bulk change from others at high volume fractions. When taking into consideration the impact of the interfacial layer the difference can reach a 3 % enhancement of viscosity for MWCNT-DI at high volume fractions. However, it should be noted that the high viscosity can impact heat transfer in nanofluids, due to the reducing the heat convection effect of liquids.
Figure 2. Comparison of proposed models for effect of volume fraction on effective viscosity for MWCNT-DI, average particle size -15 nm
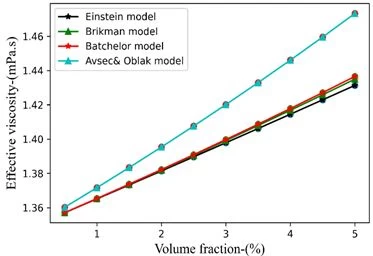
Figure 3. Comparison of proposed models for effect of temperature on effective viscosity for MWCNT-DI and CuO, average particle size -15 nm
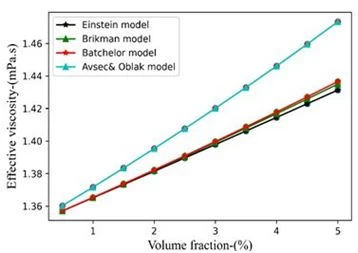
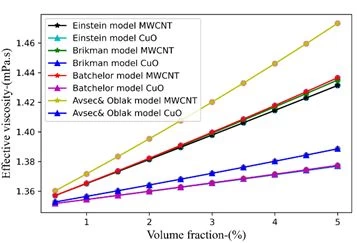
Figure 4. Comparison of viscosity of nanofluids based on MWCNT and CuO by using proposed models
Experimental investigations
We experimentally determined the dynamic viscosity of nanofluids with MWCNT nanoparticles (linear size: 10–20 nm in diameter and 10–30 μm in length), in which water was used as the base liquid. Figure 5 shows the dependences of the values of the dynamic viscosity of nanofluids with MWCNT nanoparticles and the base liquid (water) on frequency at different temperatures.
Figure 5. Dependence of the viscosity of a nanofluid with MWCNT nanoparticles and base liquid (water), on frequency, at different temperatures
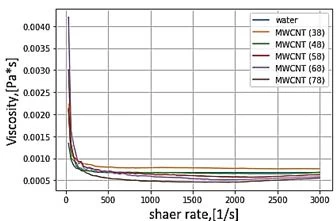
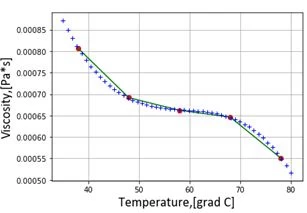
Figure 6. Dynamic viscosity of nanofluids based on MWCNT as a function of temperature
Optical characteristics of NF
Case for NF based on MWCNT (influence of particles concentration and layer thickness to the optical properties)
It should also be noted that in hybrid nanofluids, the absorption coefficient will be different for different thicknesses. These papers [23-26] present a theoretical and experimental analysis to determine the optical properties of hybrid types of nanofluids for using solar collectors of the DASC (Direct Absorption Solar Collector) type as a coolant, where the optical efficiency reached up to 97.3% at an optical path of 1 sm. length. In addition, the paper [27] presents the results of modeling the thermodynamic analysis of a parabolic trough solar collector using nanofluids based on MWCNT.
Based on the analysis of the above works, it can be concluded that nanofluids are certainly promising coolants, with the help of which it will be possible to significantly reduce the metal consumption of aggregates. This requires further complex experimental studies of their thermophysical and optical properties.
With this in mind, we conducted studies to study the effect of particle concentration and layer thickness on the optical characteristics of nanofluids based on multi-walled carbon nanotubes (MKN-MWCNT-RG1020), which is considered one of the promising materials for use as a heat transfer fluid.
Methodology
Nanofluid preparation
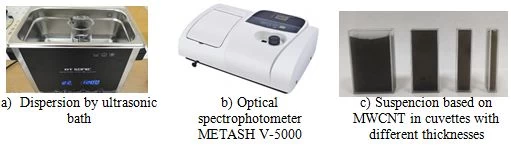
For the experiments, nanoparticles based on multi-walled carbon nanotubes (MKN-MWCNT-RG1020) with a diameter of 10–20 nm and a length of 10–30 µm were selected, and the “two step method” [28] was chosen to prepare the suspension as shown in Figure 7. In accordance with the above method, during preparation, the temperature in the ultrasonic bath was varied from 25 ̊C to 35 ̊C, and the sonication time lasted 30 minutes. The study was carried out for particle concentrations of 0.01%, 0.02% and 0.05% using water as the base fluid.
Measurement of absorbance in nanofluids
Determining the absorption of rays in the nanofluid under consideration, we used the METASH V-5000 optical spectrophotometer shown in Figure 7.b, whose measurement range is from 320 nm to 1100 nm. For the experiment, 4 types of cuvettes with different thicknesses were selected, respectively 5mm, 10mm, 20mm and 30mm.
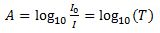
The device measures the absorption of rays in the medium depending on the radiation spectrum according to the Beer-Lambert law (3)
 (3)
(3)
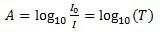
where, A is the intensity of the absorbed radiation, ε is the molar attenuation coefficient or absorptivity of the attenuating particles, l is the optical path length in sm], c is the concentration of the attenuating particles. In a generalized form, formula (1) can be rephrased as given by formula (4)
 (4)
(4)
where, A is the absorption, I0 is the incident light, I - the transmitted light and T is the transmittance.
Discussion of experimental results
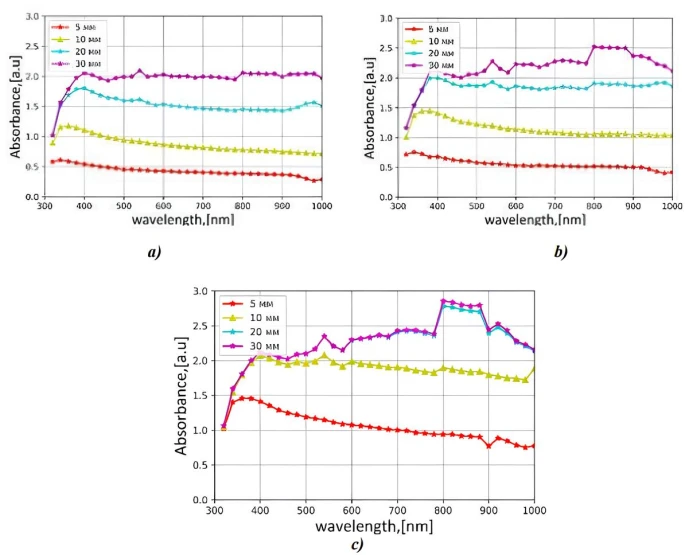
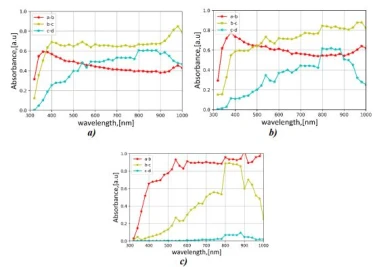
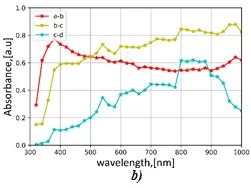
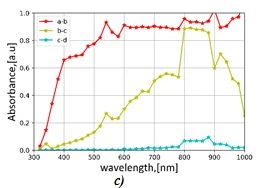
Studies have been carried out to determine the optical properties of nanofluids based on MWCNT at different concentrations with different layer thicknesses. Figure 8. a,b,c show that at different concentrations and layer thicknesses, the absorption rays depending on the radiation spectrum will be different.
As can be seen from Figure 8.a, the absorption value increases with increasing layer thickness, where the concentration of nanoparticles is 0.01% of the volume fraction. In addition, there is a sharp increase in absorption in the visible region of the spectrum with an increase in the layer thickness from 5 to 30 mm.
As shown in Figure 8.b, the absorbance value increases with increasing layer thickness. But it should be taken into account that with an increase in the concentration and with an increase in the layer thickness, a large increase in absorption in the IR region of the spectrum is observed.
It can be seen from Figure 8.c that the absorption level increases with increasing concentration and thickness of the absorption layer at a concentration of nanoparticles of 0.05%, where peaks were observed in the IR region, which gives the largest part of thermal radiation.
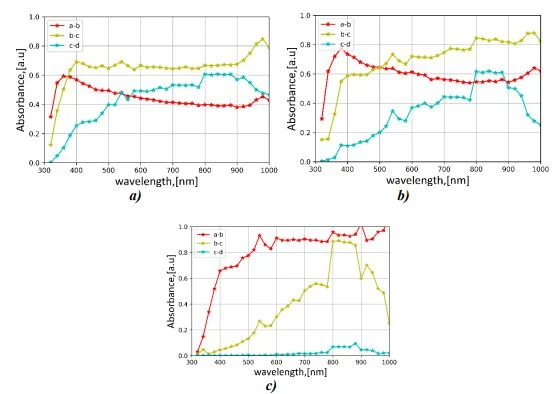
Figure 9 a, b, c shows that when the thickness changes from 5 mm to 10 mm and from 10 mm to 20 mm, the absolute values of the differences in optical densities are parallel, and when the layer thickness changes from 20 mm to 30 mm, there is a tendency for the absorption of the visible range of radiation to increase with increasing concentration particles.
Math modeling
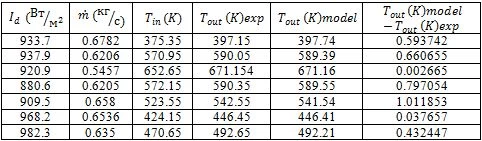
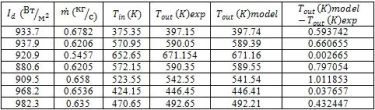
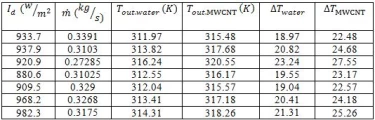
The paper [29] presents the results of studies on determining the effect of the optical properties of a nanofluid on the output values of a parabolic trough solar collector. We have also created a mathematical model of this parabolic trough solar collector. When implementing the considered model, the following conditions were accepted: - the thermal conductivity of the absorber tube and the glass shell are constant; - transverse conductivities in the absorber and glass are not taken into account; - heat losses through the end surfaces of the absorber are insignificant; - incompressible fluid with unidirectional flow.
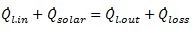
In the control volume, the heat balance can be written as follows:
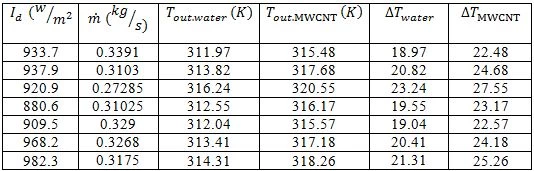
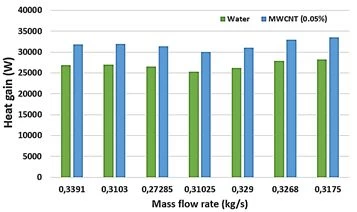
Figure 10. Comparison of beneficial heat gains in water and nanofluids based on MWCNT

Based on calculations and also experimental investigations we could conclude that, effective viscosity plays an important role to study the heat transfer behaviour of proposed nanofluids. According to analysed models, the effective viscosity is almost the same for MWCNT-based nanofluids when the interfacial layer is neglecting. However, taking into consideration the effect of the interfacial layer namely the Avsec&Oblak model the difference was about 3-4% compared to other models. In terms of the influence of temperature on effective viscosity for MWCNT-based nanofluids namely Udawattha’s model, the difference between models was remarkable. Moreover, it must be emphasized that the effective viscosity for CuO-based nanofluids was roughly 5-6% less than MWCNT-based nanofluids at high volume fraction. Regarding numerical analyses, the preferably model for obtaining effective viscosity at low concentrations was Einstein’s model, but when considering the interfacial influence, the Avsec&Oblak model had much more preference. Hence, when using Einstein’s or Brinkman’s models should be careful with the volume fraction of nanoparticles. Furthermore, it can be advised to take into account the impact of Brownian motion so far as Brownian motion of nanoparticles can enhance the effective viscosity of nanofluids as a dynamic motion with increasing temperature or particle size.
The measurement results showed that the absorption level increases with increasing concentration and thickness of the absorption layer. But with an increase in concentration, saturation of the increase in absorption occurs, so at a concentration of 0.05%, the absorption curves for the thicknesses of the absorption layer of 20mm and 30mm are almost the same.
During the experiments, a difference was established in the change in the curve of the absorption spectrum of nanofluids with different concentrations of MWCNT, with a change in the thickness of the absorption layer. In particular, the absolute difference of the absorption spectrum between the layer thicknesses of 5 mm and 10 mm decreases in the direction of the long-wavelength range of the emission spectrum at a particle concentration of 0.01%, and increases the particle concentration of 0.02%, and at a particle concentration of 0.05% almost unchanged over the entire range of the emission spectrum, the absolute difference of the absorption spectrum between the layer thicknesses of 10 mm and 20 mm is almost the same at all three concentrations and decreases towards the long-wavelength range of the emission spectrum, where the absolute difference of the absorption spectrum between the layer thicknesses of 20 mm and 30 mm tends to increase in the visible radiation range and remains almost unchanged in the long-wavelength range part of the radiation spectrum range.
Thus, the use of nanofluids based on (0.05%) MWCNT with high optical properties showed better thermal characteristics than distilled water, which increases the thermal efficiency of the solar parabolic collector by 14%.
This work was carried out within the framework of the subject “Research of the thermophysical properties of materials for the purpose of their use as heat transfer and heat storages for solar thermal installations” of the solar thermal applications Laboratory of the Physical-technical Institute of the Academy of Sciences of the Republic of Uzbekistan.
1 N. Bozorgan, M. Shafahi, Micro and Nano Systems Letters 35 (2015) 1. https://doi.org/10.5937/jaes0-28760
2 S.U.S. Choi, Developments and Applications of Non-Newtonian Flow (New York: ASME) FED 231/MD ( 1995) 66.
3 A. K. Tiwari, P. Ghosh, and J. Sarkar,. Available: www.ijetae.com (2013) [Online] www.ijetae.com
4 S. Roy, L.G. Asirvatham, D. Kunhappan, E. Cephas, and S. Wongwises, Available: (2014) . http://eds.yildiz.edu.tr/
5 R. S. Prasher and P. E. Phelan, American Society of Mechanical Engineers, Heat Transfer Division 376(2) (2005) https://doi.org/10.1115/IMECE2005-80302
6 N.G. Khlebtsov, L.A. Trachuk, and A.G. Mel’nikov, Opt. Spectrosc. 98(1) (2005) https://doi.org/10.1134/1.1858043
7 Y. Gan and L. Qiao, Energy and Fuels 26(7) (2012) https://doi.org/10.1021/ef300493m
8 Z. Said, M. H. Sajid, R. Saidur, M. Kamalisarvestani, and N. A. Rahim, Int. Commun. Heat Mass Transf. 46 (2013) https://doi.org/10.1016/j.icheatmasstransfer.2013.05.013
9 Z. Said, R. Saidur, and N. A. Rahim, Int. Commun. Heat Mass Transf. 59 (2014) 46 https://doi.org/10.1016/j.icheatmasstransfer.2014.10.010
10 S.M.S. Murshed, P. Estellé, Renew. Sustain. Energy Rev. 76 (2017) 1134 https://doi.org/10.1016/j.rser.2017.03.113
11 A. Einstein, Ann. D. Phys. 19 (1906) 289
12 H.C. Brinkman, J. Chem. Phys. 20 (4) (1952) 571 https://doi.org/10.1063/1.1700493
13 G.K. Batchelor, J. Fluid Mech. 83 (1) (1977) 97 https://doi.org/10.1017/S0022112077001062
14 J. Avsec, M. Oblak, Int. J. Heat Mass Transfer 50 (21–22) (2007) 4331 doi:10.1016/j.ijheatmasstransfer.2007.01.064
15 N. Masoumi, N. Sohrabi, A. Behzadmehr, J. Phys. D Appl. Phys. 42 (5) (2009) 55501 http://dx.doi.org/10.1088/0022-3727/42/5/055501
16 D.S. Udawattha, M. Narayana, U.P.L. Wijayarathne, J. King Saud University-Science 31 (2019) 412 https://doi.org/10.1016/j.jksus.2017.09.016
17 P. Garg, L.A. Jorge, C. Marsh, T.A. Carlson, D.A. Kessler, K. Annamalai, Int. J. Heat Mass Transfer 52 (2009) 5090 https://doi.org/10.1016/j.ijheatmasstransfer.2009.04.029
18 Z.S. Akhatov, S.Z. Mirzaev, Z. Wu, E.T. Zhuraev, T.I. Zhuraev, Applied Solar Energy (English translation of Geliotekhnika) 54(1) (2018) 50 https://doi.org/10.3103/S0003701X18010024
19 Y. Yang, E.A. Grulke, Z.G. Zhanh, G. Wu, J. Appl. Phys. 99 (2006) 114307 https://doi.org/10.1063/1.2193161
20 J. Ponmozhi, F.A.M.M. Gonçalves, A.G.M. Feirrera, I.M.A Fonseca , S. Kanagaraj, M. Martins, M.S.A. Oliveira, J. Nano Res. 11 (2010) 101 https://doi.org/10.4028/www.scientific.net/JNanoR.11.101
21 S. Sharma, A.K. Tiwari, S. Tiwari, R. Prakash, Journal of Mechanical Engineering and Sciences 12(2) (2018) 614 https://doi.org/10.15282/jmes.12.2.2018.8.0320
22 W. Fan and F. Zhong, ACS Omega 5(43) (2020) 27972 https://doi.org/10.1021/acsomega.0c03452
23 J. Sarkar, P. Ghosh, and A. Adil, Renew. Sustain. Energy Rev. 43 (2015)164 https://doi.org/10.1016/j.rser.2014.11.023
24 N.A.C. Sidik, I.M. Adamu, M.M. Jamil, G.H.R. Kefayati, R. Mamat, and G. Najafi, Int. Commun. Heat Mass Transf. 78 (2016) 68 https://doi.org/10.1016/j.icheatmasstransfer.2016.08.019
25 J. Qu, R. Zhang, Z. Wang, and Q. Wang, Appl. Therm. Eng. 147 (2019) 390 https://doi.org/10.1016/j.applthermaleng.2018.10.094
26 X. Li, G. Zeng, and X. Lei, Sol. Energy Mater. Sol. Cells 1 (2019) 110323 https://doi.org/10.1016/j.solmat.2019.110323
27 L. Knysh, Int. J. Therm. Sci. 181 (2022) 107770 https://doi.org/10.1016/j.ijthermalsci.2022.107770
28 J.S. Akhatov, E.T. Juraev, T.I. Juraev, and V.N. Avdievich, Appl. Sol. Energy (English Transl. Geliotekhnika) 54(6) (2018) 428 https://doi.org/10.3103/S0003701X18060026
29 Y. Marif, H. Benmoussa, H. Bouguettaia, M.M. Belhadj, and M. Zerrouki, Energy Convers. Manag. 85 (2014) 521 https://doi.org/10.1016/j.enconman.2014.06.002
30 V.E. Dudley, Segs LS-2 Solar Collector. (1994) 140 p.
J.S. Akhatov, T.I. Juraev, Investigation of thermo-physical properties of nanofluids based on nanoparticles of various materials for using as a heat transfer fluid for solar thermal applications, UNEC J. Eng. Appl. Sci. 2(2) (2022) 5-17
Anyone you share the following link with will be able to read this content:
This article is licensed under the Creative Commons Attribution ( CC BY 4.0 ) License, which permits unrestricted use, distribution, and reproduction in any medium, provided the original author and source are credited.


N. Bozorgan, M. Shafahi, Micro and Nano Systems Letters 35 (2015) 1. https://doi.org/10.5937/jaes0-28760
S.U.S. Choi, Developments and Applications of Non-Newtonian Flow (New York: ASME) FED 231/MD ( 1995) 66.
A. K. Tiwari, P. Ghosh, and J. Sarkar,. Available: www.ijetae.com (2013) [Online] www.ijetae.com
S. Roy, L.G. Asirvatham, D. Kunhappan, E. Cephas, and S. Wongwises, Available: (2014) . http://eds.yildiz.edu.tr/
R. S. Prasher and P. E. Phelan, American Society of Mechanical Engineers, Heat Transfer Division 376(2) (2005) https://doi.org/10.1115/IMECE2005-80302
N.G. Khlebtsov, L.A. Trachuk, and A.G. Mel’nikov, Opt. Spectrosc. 98(1) (2005) https://doi.org/10.1134/1.1858043
Y. Gan and L. Qiao, Energy and Fuels 26(7) (2012) https://doi.org/10.1021/ef300493m
Z. Said, M. H. Sajid, R. Saidur, M. Kamalisarvestani, and N. A. Rahim, Int. Commun. Heat Mass Transf. 46 (2013) https://doi.org/10.1016/j.icheatmasstransfer.2013.05.013
Z. Said, R. Saidur, and N. A. Rahim, Int. Commun. Heat Mass Transf. 59 (2014) 46 https://doi.org/10.1016/j.icheatmasstransfer.2014.10.010
S.M.S. Murshed, P. Estellé, Renew. Sustain. Energy Rev. 76 (2017) 1134 https://doi.org/10.1016/j.rser.2017.03.113
A. Einstein, Ann. D. Phys. 19 (1906) 289
H.C. Brinkman, J. Chem. Phys. 20 (4) (1952) 571 https://doi.org/10.1063/1.1700493
G.K. Batchelor, J. Fluid Mech. 83 (1) (1977) 97 https://doi.org/10.1017/S0022112077001062
J. Avsec, M. Oblak, Int. J. Heat Mass Transfer 50 (21–22) (2007) 4331 doi:10.1016/j.ijheatmasstransfer.2007.01.064
N. Masoumi, N. Sohrabi, A. Behzadmehr, J. Phys. D Appl. Phys. 42 (5) (2009) 55501 http://dx.doi.org/10.1088/0022-3727/42/5/055501
D.S. Udawattha, M. Narayana, U.P.L. Wijayarathne, J. King Saud University-Science 31 (2019) 412 https://doi.org/10.1016/j.jksus.2017.09.016
P. Garg, L.A. Jorge, C. Marsh, T.A. Carlson, D.A. Kessler, K. Annamalai, Int. J. Heat Mass Transfer 52 (2009) 5090 https://doi.org/10.1016/j.ijheatmasstransfer.2009.04.029
Z.S. Akhatov, S.Z. Mirzaev, Z. Wu, E.T. Zhuraev, T.I. Zhuraev, Applied Solar Energy (English translation of Geliotekhnika) 54(1) (2018) 50 https://doi.org/10.3103/S0003701X18010024
Y. Yang, E.A. Grulke, Z.G. Zhanh, G. Wu, J. Appl. Phys. 99 (2006) 114307 https://doi.org/10.1063/1.2193161
J. Ponmozhi, F.A.M.M. Gonçalves, A.G.M. Feirrera, I.M.A Fonseca , S. Kanagaraj, M. Martins, M.S.A. Oliveira, J. Nano Res. 11 (2010) 101 https://doi.org/10.4028/www.scientific.net/JNanoR.11.101
S. Sharma, A.K. Tiwari, S. Tiwari, R. Prakash, Journal of Mechanical Engineering and Sciences 12(2) (2018) 614 https://doi.org/10.15282/jmes.12.2.2018.8.0320
W. Fan and F. Zhong, ACS Omega 5(43) (2020) 27972 https://doi.org/10.1021/acsomega.0c03452
J. Sarkar, P. Ghosh, and A. Adil, Renew. Sustain. Energy Rev. 43 (2015)164 https://doi.org/10.1016/j.rser.2014.11.023
N.A.C. Sidik, I.M. Adamu, M.M. Jamil, G.H.R. Kefayati, R. Mamat, and G. Najafi, Int. Commun. Heat Mass Transf. 78 (2016) 68 https://doi.org/10.1016/j.icheatmasstransfer.2016.08.019
J. Qu, R. Zhang, Z. Wang, and Q. Wang, Appl. Therm. Eng. 147 (2019) 390 https://doi.org/10.1016/j.applthermaleng.2018.10.094
X. Li, G. Zeng, and X. Lei, Sol. Energy Mater. Sol. Cells 1 (2019) 110323 https://doi.org/10.1016/j.solmat.2019.110323
L. Knysh, Int. J. Therm. Sci. 181 (2022) 107770 https://doi.org/10.1016/j.ijthermalsci.2022.107770
J.S. Akhatov, E.T. Juraev, T.I. Juraev, and V.N. Avdievich, Appl. Sol. Energy (English Transl. Geliotekhnika) 54(6) (2018) 428 https://doi.org/10.3103/S0003701X18060026
Y. Marif, H. Benmoussa, H. Bouguettaia, M.M. Belhadj, and M. Zerrouki, Energy Convers. Manag. 85 (2014) 521 https://doi.org/10.1016/j.enconman.2014.06.002
V.E. Dudley, Segs LS-2 Solar Collector. (1994) 140 p.