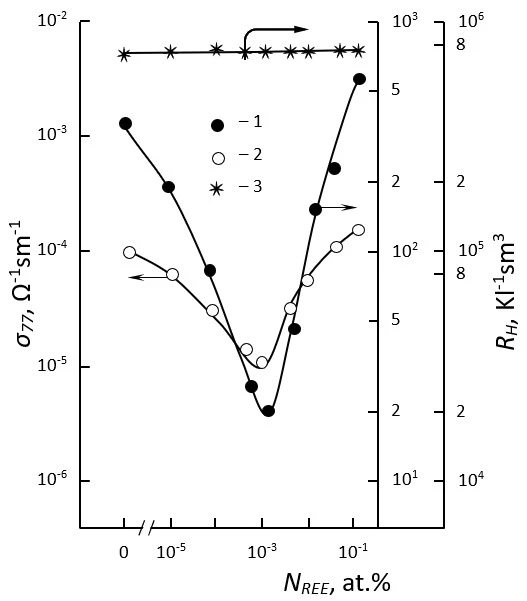
Figure 3. Dependence of the specific electrical conductivity (curve 1), the mobility of free main charge carriers (curve 2), and the Hall coefficient (curve 3) in n-InSe crystals doped with rare earth elements on the amount of dopant added to the sample T=77 K
Back to article page