From: Formation of CrSi2 film and measurement of optical band gap energy
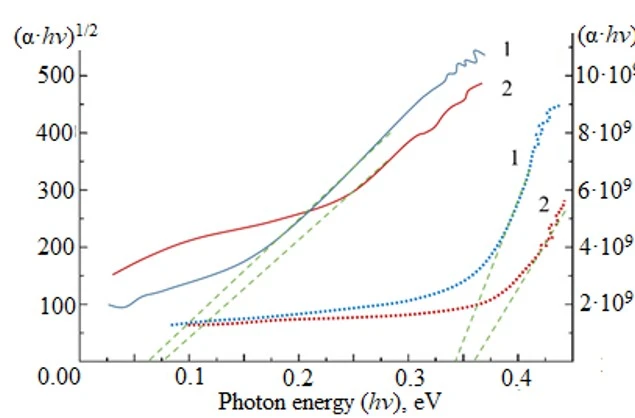
Figure 10. Tauc diagrams for indirect and direct band gaps of amorphous (sputtered) and nanostructured (annealed) CrSi2 thin films.
1 –– Amorphous film, 2 –– Nanostructured film. The green dotted lines show the linear fit to the Tauc plot