UNEC Journal of Engineering and Applied Sciences Volume 2 No 1, pages 51-57 (2022) Cite this article, ![]() 2203
2203
Dietary fiber, particularly pectin, is among the most important components of the human diet. A lack of dietary fiber in everyday meal could negatively affect human health by increasing the risk of serious diseases including cancer [1,2]. Pectin has a wide spectrum of functional properties in addition to favorable affects on the gastrointestinal tract [3]. Due to their emulsifying and getion properties, pectins are widely used by the food industry as stabilizers and gelling agents for mass-produced food [4]. Pectin from different sources exhibit antioxidative [5], anti-hypertensive [6], cytoprotective [7], immunomodulatory [8], hypocholesterolemic, hypoglycemic, probiotic and other activities [9,10], that provide a promising basis for a wide range of functional foods.
Pectins are a structurally heterogeneous group of soluble dietary fibers with high galacturonic acid (GalA) content. The latter forms acidic and neutral polymers. The majority of pectins include linear homogalacturonan polymer containing 100 to 200 residues of galacturonic acid connected via (1-4) – α – glucoside bonds, which is the simplest structural element of pectin. In addition, homogalacturonan side chains can de esterified by linear or branched rhamnose oligosaccharides (rhamnogalacturonans I) and region of alternating D-galacturonic acid and L-rhamnose residues substituted with various sugars can be present in the pectin structure (rhamnogalacturonans II) [11]. The structural features of pectin largely determine its technological and biofunctional properties. Low-esterified pectin readily forms complexes with divalent metals, including ions of toxic elements (mercury, lead and cadmium), which leads to a decrease in the cytotoxic effects of heave metals [12].
The plant source and extraction method are important factors determination pectin properties. Variations in extraction methods and conditions can yield fractions with different molecular weight, degree of esterification and branching and phenol and sugar contents [13]. The most widely used method hot acidic extraction, mostly preserves the original pectin structure but also leads to environmental concerns due to acid usage [14]. Other methods, such as enzymatic extraction or microwave-assisted extraction can result in shorted polysaccharide fragments with higher yields [15].
Medlar is the fruit of Mespilus germanica L., in the family of Rosaceae. It grows poorly in frost-free areas and rocks and in poor soils. Medlar grows wild in various regions of Azerbaijan [16]. Medlar fruits are very rich sources of bioactive compounds and a promising source of pectin with distinctive features such as high degrees of esterification and branching.
In this work we focus on the characterization of pectin from Medlar fruits. The method of choice for pectin extraction was a novel cavitation facilitated method that provided good pectin yield without additional acid.
2.1. Materials
Ripe medlar (M. germanica L.) fruits were used for all the experiments in this study. The seeds of fruit were washed by a tap water and cut into pieces of 0,1-0,3 cm3.
Specially prepared water with electrical volume resistivity not less than 10 m |cm at 20 0C was used as an extracting agent, pH of the extraction media was within the range of 3,5-3,8. The pectin extraction process was a result of cavitational activation of water molecules with formation of active H3O+ radicals [17].
All the chemicals used in the study were of the highest purity available commercially or analytical grade.
2.2. Pectin extraction
Pectin extraction was performed according to [18,19]. Freshly pieces of seeds medlar fruits was mixed with water in the proportion of 1:(8-10) (w/v). The pectin extraction process was performed at 65-70 0C during 15-30 min using a rotor-pulsation device MT-1500 (Kinematica, Switzerland). This resulted in disintegration of solid phase and high rate pectin extraction in liquid phase.
Further processing consisted in multi-stage filtration to remove the solid phase, purification on kieselguhr filter, filtration on membrane filters in ultra- and diafiltration modes to remove low-molecular weight impurities. Cleared and partly concentration pectin-containing liquid phase was further subjected to low-temperature concentration. The resulting concentrate was spray dried to obtain high grade purity pectin powder.
2.3. Physicochemical characterization of seed medlar fruits
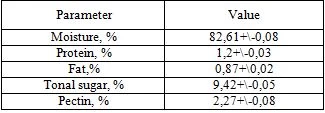
The contents (w/v) of the seed were determined using average measurements (Table 1). The protein (Nx6,25), moisture, fat and total sugar contents of the seed, the sum of hydropectin and protopectin content were determined by approved AOAC methods (1995) [20].
Table 1. Chemical composition of seed medlar fruit
2.4. Physicochemical characterization of pectin
The nitrogen (Method 920,152), ash, acid-insoluble ash (Method 923,03) content and loss on drying of pectin were determined by approved AOAC methods (1990) [21]. Total phenol content in pectin after saponification with 1M sodium hydroxide solution was determined according to [20] with gallic acid as a standard and expressed in in mg of gallic acid equivalents (GAE) per g Carotenoid content was determination by UV-Vis spectroscopy according to [22]. Three replicates were run for each pectin sample.
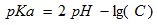
The pH of the 0,3 and 1,2% (w/vol) pectin solution at 25oC and amount of titrated carboxylic groups were determined with a pH meter (Seven Easy Multi, Mettler-Toledo, Germany). Pectin solution were titrated with 0.1 M hydrochloric acid and 0,1 M sodium hydroxide solutions up to pH 2,5 and 10,5 respectively. Based of the amount of titrated carbolic groups (C), pKa values of pectin were calculated according to (1);
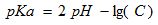 (1)
(1)
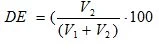
The degree of esterification (DE) was assessed by a direct titrimetric method. Approximately 0.5 g of pectin was weighted into filtering crucible (porosity 2). After addition of 20 ml of acidified 75% ethanol (50 ml of concentrated hydrochloric acid per 1.0 L of 75% ethanol) the crucible was connected to the filtration system. Pectin was washed with 20 mL portions of acidified ethanol up until the negative reaction of filtrate with 0/1% ethanolic alizarin solution was observed. The residue was washed with 70 % ethanol up until the negative reaction of filtrate with 0.05% silver nitrate solution in 1 M nitric acid was observed. The residue on the filter was quantitatively transferred into 250 mL conical flask by pouring distilled water heated up to 40 o C. Final volume of pectin solution was adjusted to 100 mL. After pectin was completely dissolved 6 drops of Hinton indicator ( mixture of 0.4% aqueous solution of bronthymol blue, cresol red and phenol red 1:1:3 voL:voL:voL) were added to the pectin solution and it was titrated with 0.1 M sodium hydroxide solution up until pink coloring was stable for at least 30 s and the resulting NaOH volume was recorded as V1 . Then 50 mL of 0.1 M sodium hydroxide solution were added, the mixture was incubated for 1 h ar room temperature for pectin deesterification with subsequent addition of 50 mL of 0.1 M hydrochloric acid. The excess of hydrochloric acid was titrated with 0.1 M sodium hydroxide solution and the resulting volume was recorded as V2 / The DE was calculated according to (2);
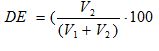 (2)
(2)
All experiments were carried in three replicates.
2.5. Analysis of monosaccharide composition
The sample (10mg) was hydrolyzed in 2 M trifluoroacetic acid (2mL) at 100 o C for 8 h. The hydrolysate was cooled to ambient temperature and dried by nitrogen in a water bath (70 0C). Hydroxylamine hydrochloride (10 mg) and pyridine (0,5 mL) were then added. The mixture was incubated at 90 0C for 30 min with shaking. After cooling 0,5 mL of acetic anhydride was added to the mixture and shaken at 90 0C for 30 min again. The derivatives were obtained after filtering through the organic filter membrane. Quantification was performed by gas chromatography (6890 N, Agilent Technologies Co, USA) equipped with a hydrogen flame ionization detector. The column used was DB1701 (30 m x 0,25 mm x 0,25 mkm) and nitrogen served as a carrier gas. The following temperature program was used: initial temperature of 170 o C was maintained for 2 min, then the temperature was raised to 250 o C with a rate of 10 0C per min and the final temperature of 250 o C was maintained for 10 min.
The determination of polygalacturonic acid (poly-GalA) content was performed by the 3,5-dimethylphenol (DMP) method according to [23], using D-galacturonic acid as a standard. Acid hydrolysis of pectin was carried out in 7 mL tubes screw cap. The reaction mixture contained 50 mkL of pectin solution (1 mg mL -1), 650 mkL of deionized water, 3.0 mL of 0.1% sodium chloride solution in concentrated sulfuric acid (96 % w/w). The blank mixture contained 50 mkL of deionized water instead of pectin solution. The standard sample contained 400 mkL of 25-150 mg mL-1 D (+)-galacturonic acid solution, 300 mkL of deionized water, 3.0 mL of 0.1% sodium chloride solution in concentrated sulfuric acid (96% w/w). After the reaction mixture preparation, each tube was vortexed for 15 s and kept on ice. Two replicates were run for each pectin sample or concentration of standard. The reaction tubes were tightly sealed with screw caps and incubated for 15 min in water bath at 80 o C. After cooling to room temperature aliquots (150 mkL) of each reaction mixture were transferred to the wells of non-binding 96-well microplate (Greiner Bio-one< Germany) in 12 replicates 50 mkL of glacial acetic acid was added to half of the replicates. The plate was inserted into a multi-detection microplate reader Synegry 2 (Bio Tek, USA), shaken for 10 s at a speed of 400 rpm with subsequent reading oh the absorbance at 450 nm (30 s after the addition of acetic acid). 50 mkL of 0.2% (w/v) DMP solution. The initial absorbance values were subtracted from those observed after the addition of DMP solution and the poly-GalA content in pectin was calculated on dry and ash-free basis.
2.6. Molecular mass distribution
Molecular mass of pectin samples was determined using gel filtration and viscosimetric methods the gel filtration method allows determining the molecular mass as well a homogeneity of the pectin tested. The gel filtration was performed using Sephadex G-75 with 0,05 M NaOH as an eluent.
2.7. IR-Fourier spectroscopy
Infraed spectra were obtained using IR-Fourier spectrometer Agilent Cary 660 (Agilent Technologies) with the accessories (ZnSe crystal with a 450 incidence angle) for the Attenuated Total Reflectance (ATR) analysis/ ATR spectra were collected by using 128b scan at 2 cm-1 resolution in range of 4000-650 cm-1. A portion of the sample (1+/-0,01 g) was placed on the ZnSe crystal for measurement.
2.8. Intrinsic viscosity
The intrinsic viscosity was determined by capillary viscosity experiments. The pectin samples were dissolved by stirring in deionized water for 2 h at room temperature. The dissolved pectin was treated with cation exchange resin (Amberlite 120 H+) to protonate pectin before viscosimetric analysis and then the stock sodium chloride solution was added to obtain the desired salt concentration. 5 mL of the sample solution was filtered through a 0.22 mkm nylon membrane and loaded into Ubbelohde capillary (capillary no. Oa, JD, 0,53 mm) with k constant of 0,005. Viscosity measurement were carried out in a water bath at 35,00 +/- 0/02 0C with the initial pectin concentration of 0.001-0.005 g mL-1, using a Schott AVS-360 automatic dilution viscometer system.
The evaluation of pectin molecular weight by intrinsic analysis was performed according to [24]. The intrinsic viscosity was determined by extrapolating the [ ] C – C curve and the (lg ) /C – C curve to zero and averaging the value of the intercept. The average viscosimetric molecular weight was calculated by applying the Mark-Houwink equation where is the intrinsic viscosity:
2.9. Statistical analysis
All experiments were performed in three replicates and obtained data were analyzed by one-way ANOVA followed by Tukey’s HSD (honestly significant difference) post-hoc tests (p<0,05). Whenever appropriate, data are represented by the mean +/- standard deviation (s.d.).
3.1. Extraction of medlar pectin
In the current study, the novel cavitation facilitated method of pectin extraction was adopted [19]. The yield of medlar pectin extracted by this method was 82.7 %. Comparable yield of pectin together with environmental safety and absence of additional acid treatment make our method very attractive for industrial application.
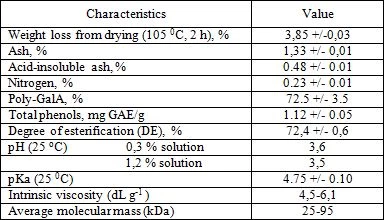
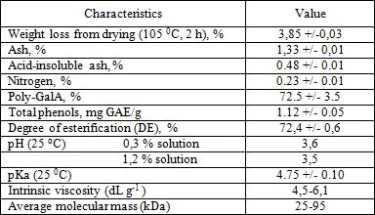
3.2. Physicochemical characteristics of pectin
The functionality of pectin is closely related to its physicochemical characteristics, including poly-GalA content, degree of esterification (DE), molecular weight, etc. Physicochemical characteristics of the investigation pectin are summarized in Table 2. The medlar pectin are highly methoxylated (DT more 50%) and had low nitrogen content (<0.3%).
3.3. Structural characterization of the pectin
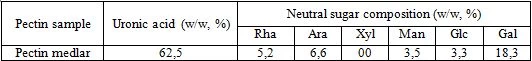
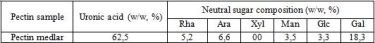
On the table 3 presents the date on monosaccharide composition of the pectin under investigation. Five different neutral sugars were found in pectin samples: rhamnose, arabinose, galactose, glucose and mannose.
Two types of polysaccharide regions were observed in the pectin medlar: smooth region (homogalacturonan) and hairy region (rhamnogalacturonan). The most complex pectin strucrure, rhamnogaluctoranan I (RG-I), has a backbone of alternating galacturonic acid and L-rhamnose residues, with branching structures consisting of D-galactose and L-arabinose chains attached to the L-rhamnose. The presence of rhamnose, galactose and arabinose could indicate that pectin medlar contain RG-I region with side chains such as arabinan, galactan and arabinogalactan.
3.4. FT-IR analysis
Analysis of the FT-IR spectra was performed to identify the major functional groups of the pectin. The FT-IR spectrum of pectin showed typical peaks for a number of specific groups. The intensive broad asymmetrical peak with a maximum at 3200 - 3600 cm-1 corresponds to valence oscillations of OH-groups in the pectin molecule. The aria of approximately 2926 cm-1 contain the peaks corresponding to oscillation of different groups containing C-H bonds. The area of 1500-2000 cm-1 corresponds to oscillations of C=O groups. The characteristic peaks of ester and carboxylic C=O vibration were observed at 1730-1760 cm-1 (COO-R) and 1600-1630 cm-1 (COO-) respectively. It has been shown that the relative intensity of the last two peaks is related to the degree of methoxylation.
The region between 1200-and 800 cm-1 is referred to as the fingerprint region and the intensity of the individual bands in this region are unique for each polysaccharide. According to [25] the fingerprint region of pectin is represented by characteristic bands at 1145, 1103, 1077, 1050 and 1017 cm-1. At the same time, the absorption bands at 1145, 1104 and 1020 cm-1 are typical for pectin polymers and the bands at 1077 and 1050 cm-1 correspond to vibrations of neutral arabinose and galactose-based glycans [25]. In that spectral region the characteristic peaks 1146, 1095, 1074, 1050 and 1015 cm-1 were present in the pectin spectrum.
The present study demonstrates the efficienty of the cavitation-facilitated extraction method for the extraction of pectin from medlar fruit seeds with the yield being 82,7%. Extraction conditions influence the fine structure of pectin. The present isolation protocols resulted in high molecular weight pectin with a high degree of methoxylation. In this research we showed that the poly-GalA content, different degree of branching and esterification and monosaccharide composition of the side chains altogether influence the rheological and functional properties of pectin.
It is indicates the potential of medlar fruit as a source of new functional foods with agricultutal origin.
1 L. Kushi, C. Doyle, M. McCollough, C. Rock, CA Cancer J. Clin. 62 (2012) 30.
2 L. Pietizyk ,A. Torres, R. Maciejewski, K. Torres, Asian Pacific J. Cancer Prev. 16 (2015) 4161.
3 I.A. Brownlee, Food Hydrocol 25 (2011) 238.
4 T. Funami, Food Hydrocoll 25 (2011) 1904.
5 D. Torrado, K. Batista, M. Di-Medeiros, K. Femandes, Food Hydrocoll 27 (2012) 378.
6 Z. Baluja, S. Kaur, Bull Pharm. Med. Sci. 1 (2013) 9.
7 X. Yang, Y. Zhao, Y. Lu, J. Agric Food Chem. 55 (2007) 4684.
8 M. Kratchanova, M. Nikolova, E. Pavlova, I. Yenakieva, V. Kussovski, J. Sci. Food Agric 90 (2010) 2046.
9 J. Holck, A. Hotchkiss, A. Meyer, J. Mikelsen, R. Rastall, Food Oligosaccharides (2014) 76.
10 L. Wicker, Y. Kim, M. Kim, B. Thirkield, Z. Lin, J. Jung, Food Hydrocoll 42 (2014) 251.
11 B. Ridley, M. O’Neil, D. Mohnen, Phytochemisrty 57 (2001) 929.
12 M.E. Dalia , J. Am. Sci. 6 (2010) 541.
13 Z. Kostalova, Z. Hromadkova, A. Ebringerova, Carbohydr. Polym. 93 (2013) 163.
14 N. Ptichkina, O. Markina, G. Rumyantseva, Food Hydrocoll 22 (2008) 192.
15 S. Cui, Y. Chang, LWT-Food Sci. Technol. 58 (2014) 396.
16 H. Haciseferogullari, M. Ozcan, M.H. Sonmete, O. Ozbek, J. of Food Engineering 69 (2005) 1.
17 V.N. Golubev. Proc. 7th Inter. Conf. on Ultrasound. Copengagen (1996) 174.
18 V.N. Golubev. Proc. 7th Inter. Conf. on Ultrasound. Copengagen (1996) 174.
19 V.N. Golubev, N.P. Sheluhina, Academic Press. Moscow. 387 (1995).
20 AOAC International. Official methods of analysis of AOAC International. 16th ed. Cunniff K., editor Arlington, Va: AOAC International. 1995.
21 AOAC International. Official methods of analysis of AOAC International.15th ed. Henrich K. Еditor Arlington. Virginia. USA.: Association of Official Analysis Chemists. Inc.; 1990.
22 H. Lichtenthaler, C. Buschmann, Handb Food Anal Chem. 2-2 (2005) 171.
23 G.A.Lusio, Proc. Fla State Hort Soc. (2004) 416.
24 D. Hourdet, G. Muller, Carbohydr. Polym. 16 (1991) 113.
25 M. Urakova, P. Capek, V. Sasinkova, N. Wellner, A. Ebringerova, Carbohydr. Polym. 43 (2000) 195.
E.B. Farzaliev, V.N. Golubev, Some physicochemical properties of wild medlar (Mespilus germanica L.) pectin, UNEC J. Eng. Appl. Sci 2(1) (2022) 51-57
Anyone you share the following link with will be able to read this content:
This article is licensed under the Creative Commons Attribution ( CC BY 4.0 ) License, which permits unrestricted use, distribution, and reproduction in any medium, provided the original author and source are credited.

L. Kushi, C. Doyle, M. McCollough, C. Rock, CA Cancer J. Clin. 62 (2012) 30.
L. Pietizyk ,A. Torres, R. Maciejewski, K. Torres, Asian Pacific J. Cancer Prev. 16 (2015) 4161.
I.A. Brownlee, Food Hydrocol 25 (2011) 238.
T. Funami, Food Hydrocoll 25 (2011) 1904.
D. Torrado, K. Batista, M. Di-Medeiros, K. Femandes, Food Hydrocoll 27 (2012) 378.
Z. Baluja, S. Kaur, Bull Pharm. Med. Sci. 1 (2013) 9.
X. Yang, Y. Zhao, Y. Lu, J. Agric Food Chem. 55 (2007) 4684.
M. Kratchanova, M. Nikolova, E. Pavlova, I. Yenakieva, V. Kussovski, J. Sci. Food Agric 90 (2010) 2046.
J. Holck, A. Hotchkiss, A. Meyer, J. Mikelsen, R. Rastall, Food Oligosaccharides (2014) 76.
L. Wicker, Y. Kim, M. Kim, B. Thirkield, Z. Lin, J. Jung, Food Hydrocoll 42 (2014) 251.
B. Ridley, M. O’Neil, D. Mohnen, Phytochemisrty 57 (2001) 929.
M.E. Dalia , J. Am. Sci. 6 (2010) 541.
Z. Kostalova, Z. Hromadkova, A. Ebringerova, Carbohydr. Polym. 93 (2013) 163.
N. Ptichkina, O. Markina, G. Rumyantseva, Food Hydrocoll 22 (2008) 192.
S. Cui, Y. Chang, LWT-Food Sci. Technol. 58 (2014) 396.
H. Haciseferogullari, M. Ozcan, M.H. Sonmete, O. Ozbek, J. of Food Engineering 69 (2005) 1.
V.N. Golubev. Proc. 7th Inter. Conf. on Ultrasound. Copengagen (1996) 174.
V.N. Golubev. Proc. 7th Inter. Conf. on Ultrasound. Copengagen (1996) 174.
V.N. Golubev, N.P. Sheluhina, Academic Press. Moscow. 387 (1995).
AOAC International. Official methods of analysis of AOAC International. 16th ed. Cunniff K., editor Arlington, Va: AOAC International. 1995.
AOAC International. Official methods of analysis of AOAC International.15th ed. Henrich K. Еditor Arlington. Virginia. USA.: Association of Official Analysis Chemists. Inc.; 1990.
H. Lichtenthaler, C. Buschmann, Handb Food Anal Chem. 2-2 (2005) 171.
G.A.Lusio, Proc. Fla State Hort Soc. (2004) 416.
D. Hourdet, G. Muller, Carbohydr. Polym. 16 (1991) 113.
M. Urakova, P. Capek, V. Sasinkova, N. Wellner, A. Ebringerova, Carbohydr. Polym. 43 (2000) 195.